
Despite a dry month, October 1st is the start of the regulated flood season in King County, Washington which ranks 13th out of 39 counties in agricultural revenue and is home to Seattle, the State’s largest city. From almost 1,800 farms, $127 million is earned growing food, fiber, and animal feed, even though the County houses almost one-third of the State’s 6.7 million people. Combined Snohomish, King, Pierce and Thurston counties generate $435 million in agricultural revenue from over 6,000 farms.
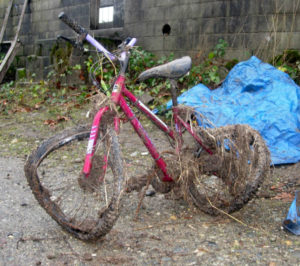
Remnants of the November 2006 Flood
It has been almost 7 years since the November 2006 election day 100-year storm. In 60 degree weather, Monday, November 6, 2006, 3.29 inches of rain fell at Sea-Tac airport. Concurrently, the warm, tropical, moisture-laden clouds, also known as a Pineapple Express, pummeled the Cascade Mountain’s western facing slopes about 60 miles east of Seattle, melting newly fallen snow and sending torrents of water into the lowlands. The flat Snoqualmie Valley received more than 32 million gallons per minute (71,800 cubic feet per second [c.f.s.]) of turbid, rapid-flowing water carrying anything not secured.
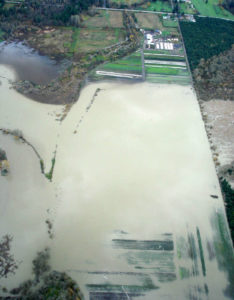
2006 Flood at Full Circle Farm, Carnation (Photo courtesy of Stewardship Partners)
Only two years and two months later, in January 2009, another 100-year Pineapple Express storm inundated the Snoqualmie Valley with an amplified repeat performance surging 37 million gallons per minute (82,900 c.f.s.) downstream reaching an unprecedented flood stage of 62.21 feet near Carnation, which was almost one foot higher than the 2006 record of 61.28 feet.
Despite the misnomer that a 100-year storm happens only every 100-years, in scientific terms it is the storm that has a 1% probability of happening in any particular year. With probability theory, there is really a 63.4% chance of a 100-year storm occurring in each wet season. Consequently, the chances of another devastating flood happening is much greater than it not occurring.
Thankfully, many western Washington counties have heeded Mother Nature’s wrath and now provide tools for farmers and homeowners to be warned of upcoming fury from exceptional weather systems.
King County’s Flood Alert System
King County has designed a message alert system to send texts, e-mails or phone calls to those who have signed up with the free King County Flood Alerts system for timely information on flood events. Notification of 3-different flood stages on the Cedar, Green, Tolt, and White Rivers, Issaquah Creek and for the Snoqualmie Basin are sent. The first notification level is Phase 2 indicating minor flooding in some areas. The Phase 3 message designates moderate flooding, while a Phase 4 notice signifies that there will be road closures and major impacts from the deluge. These alerts show the level of storm impact and are beneficial even for those people not directly in harm’s way, since excessive rainfall can impact travel plans and localized flooding, too.
Another informative Snoqualmie River tool is Floodzilla, created by a computer geek that wanted real time information on predicting whether there will be a noteworthy flood event. He didn’t want to receive notifications as each flood phase was reached, since that could be in the middle of the night. Rather he wanted to see what the National Oceanic & Atmospheric Administration (NOAA) computer model predicted for future flood potential. His model can forecast flood elevations up to three days ahead based on anticipated rainfall, which gives homeowners time to prepare for a flood.
As shown on the above graph, the Snoqualmie River is expected to reach minor flood stage at Carnation (red line), mid-day Tuesday, November 19th and then begin to recede. The forecast is predicting additional precipitation late Wednesday or early Thursday morning, which will slightly increase the river’s flow, but not reach flood stage.
Thurston County’s Emergency Management System
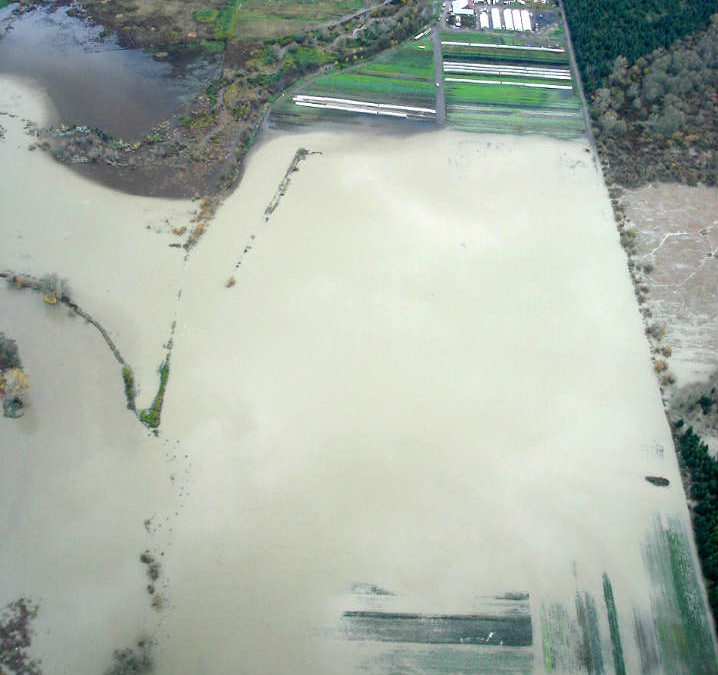
Thurston County Emergency Management has the most usable interface for flood monitoring for the layperson for the Black, Chehalis, Deschutes, Nisqually and Skookumchuck Rivers. The two pieces of information on the Emergency Management website are 1) a graph of the river water elevation for a full week, including the previous 3 days, the next 3 days and today and 2) a table depicting the different flood elevations with the potential impacts from too much water in the drainage basin. On the graph above, the amateur flood watcher can see whether the water elevation is expected to continue to rise on the Chehalis River at Grand Mound, or when the flood stage is expected to start falling. On this January 11, 2014 graph, the flow and water rates are expected to rise through the weekend with the weekend storm, but no significant flooding is currently expected.
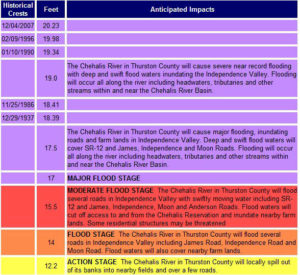
Chehalis River Historic Flood Stages
At the same time, as shown on the table to the right, there are dates of past flood events with the expected damage at each flood elevation which can help homeowners anticipate whether they should consider evacuating to higher ground or not. With the expected 11.5 foot water elevation later this weekend, the river is not anticipated to reach the 12.2 foot elevation when minor flooding begins with banks overflowing into nearby fields and over a few roads. It will be interesting to monitor the online real-time graph throughout the weekend to see if there will be additional flood concerns. Minor fluctuations in temperature in the mountains, where the precipitation changes from snow to rain or the intensity of the lowland storm changes could change the current predictions.
Pierce County’s Flood Alert and Mapping System
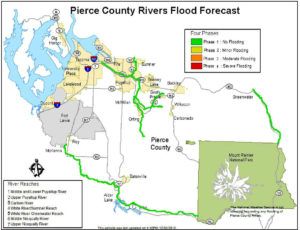
Pierce County Rivers Flood Forecast
The Pierce County Alert System has a flood alert system where the County will e-mail, text or phone you with critical information about the status of specific County rivers. More importantly, the County has a “quick look” flood status map, called the Pierce County Flood Monitor, which expeditiously depicts where flooding is occurring. This map is real time, but does not give any indication of anticipated future flood flows.
Snohomish County’s Flood Mapping System
Snohomish County Flood Warning System has a great map that is updated every 15 minutes with flood information at key locations along major County rivers. Depending on the color of the square on the map, a quick observation of the flood status can be determined. A green square signifies normal flow, a yellow square depicts a Phase 2 flood elevation, which has minimal impacts, Phase 3 (orange) and Phase 4 (red) signify increasing flood concerns. Clicking on a square pops up a new window where the river elevation in relation to the flood phases can be compared.
Prepare Yourself
As we head into flood season it is important to find out what information is available in your County and sign-up for alerts or “bookmark” your river resource, so you can take precautions to protect your livelihood and home. These are amazing tools our government have created to help us prepare for flooding and it is important to take advantage of them. With a 63% chance of a 100-year storm event any given wet season, it is critical to be prepared.
Kathryn Gardow, P.E., is a local food advocate, land use expert and principal of Gardow Consulting, an organization dedicated to providing multidisciplinary solutions to building sustainable communities. Kathryn has expertise in project management, planning, and civil engineering, with an emphasis on creating communities that include local food production.